Abschlussbedingungen
Why Reapply the Sensor?
The coACTION Sensor gives your school a snapshot of how democratic values are lived and experienced in everyday school life. Reapplying it now allows you to compare current results with those from the beginning of the year (Module 2), showing what has improved and what still needs attention.
When Should We Do This?
You decide! Many schools choose a fixed time each year (e.g., every September). You can also align this step with other reflection activities or project milestones.
Step-by-Step: How to Reapply the Sensor
-
Access the Sensor platform.
Go to the same link used in Module 2. -
Log in with your access code.
-
If you still have a valid code, it may work again.
-
If not, request your new annual code from the programme coordinator.
-
-
Choose the same format and target group.
-
Keep consistency: same student ages, same staff or parents if possible.
-
This ensures results can be compared fairly.
-
-
Conduct the Sensor again.
-
Allow 1–2 weeks for people to respond.
-
Offer reminders and support to ensure a good participation rate.
-
-
Download and save the results.
-
Export them as a PDF or spreadsheet.
-
You’ll use them in the next session for analysis.
-
Deviation Analysis: Compare Results Over Time
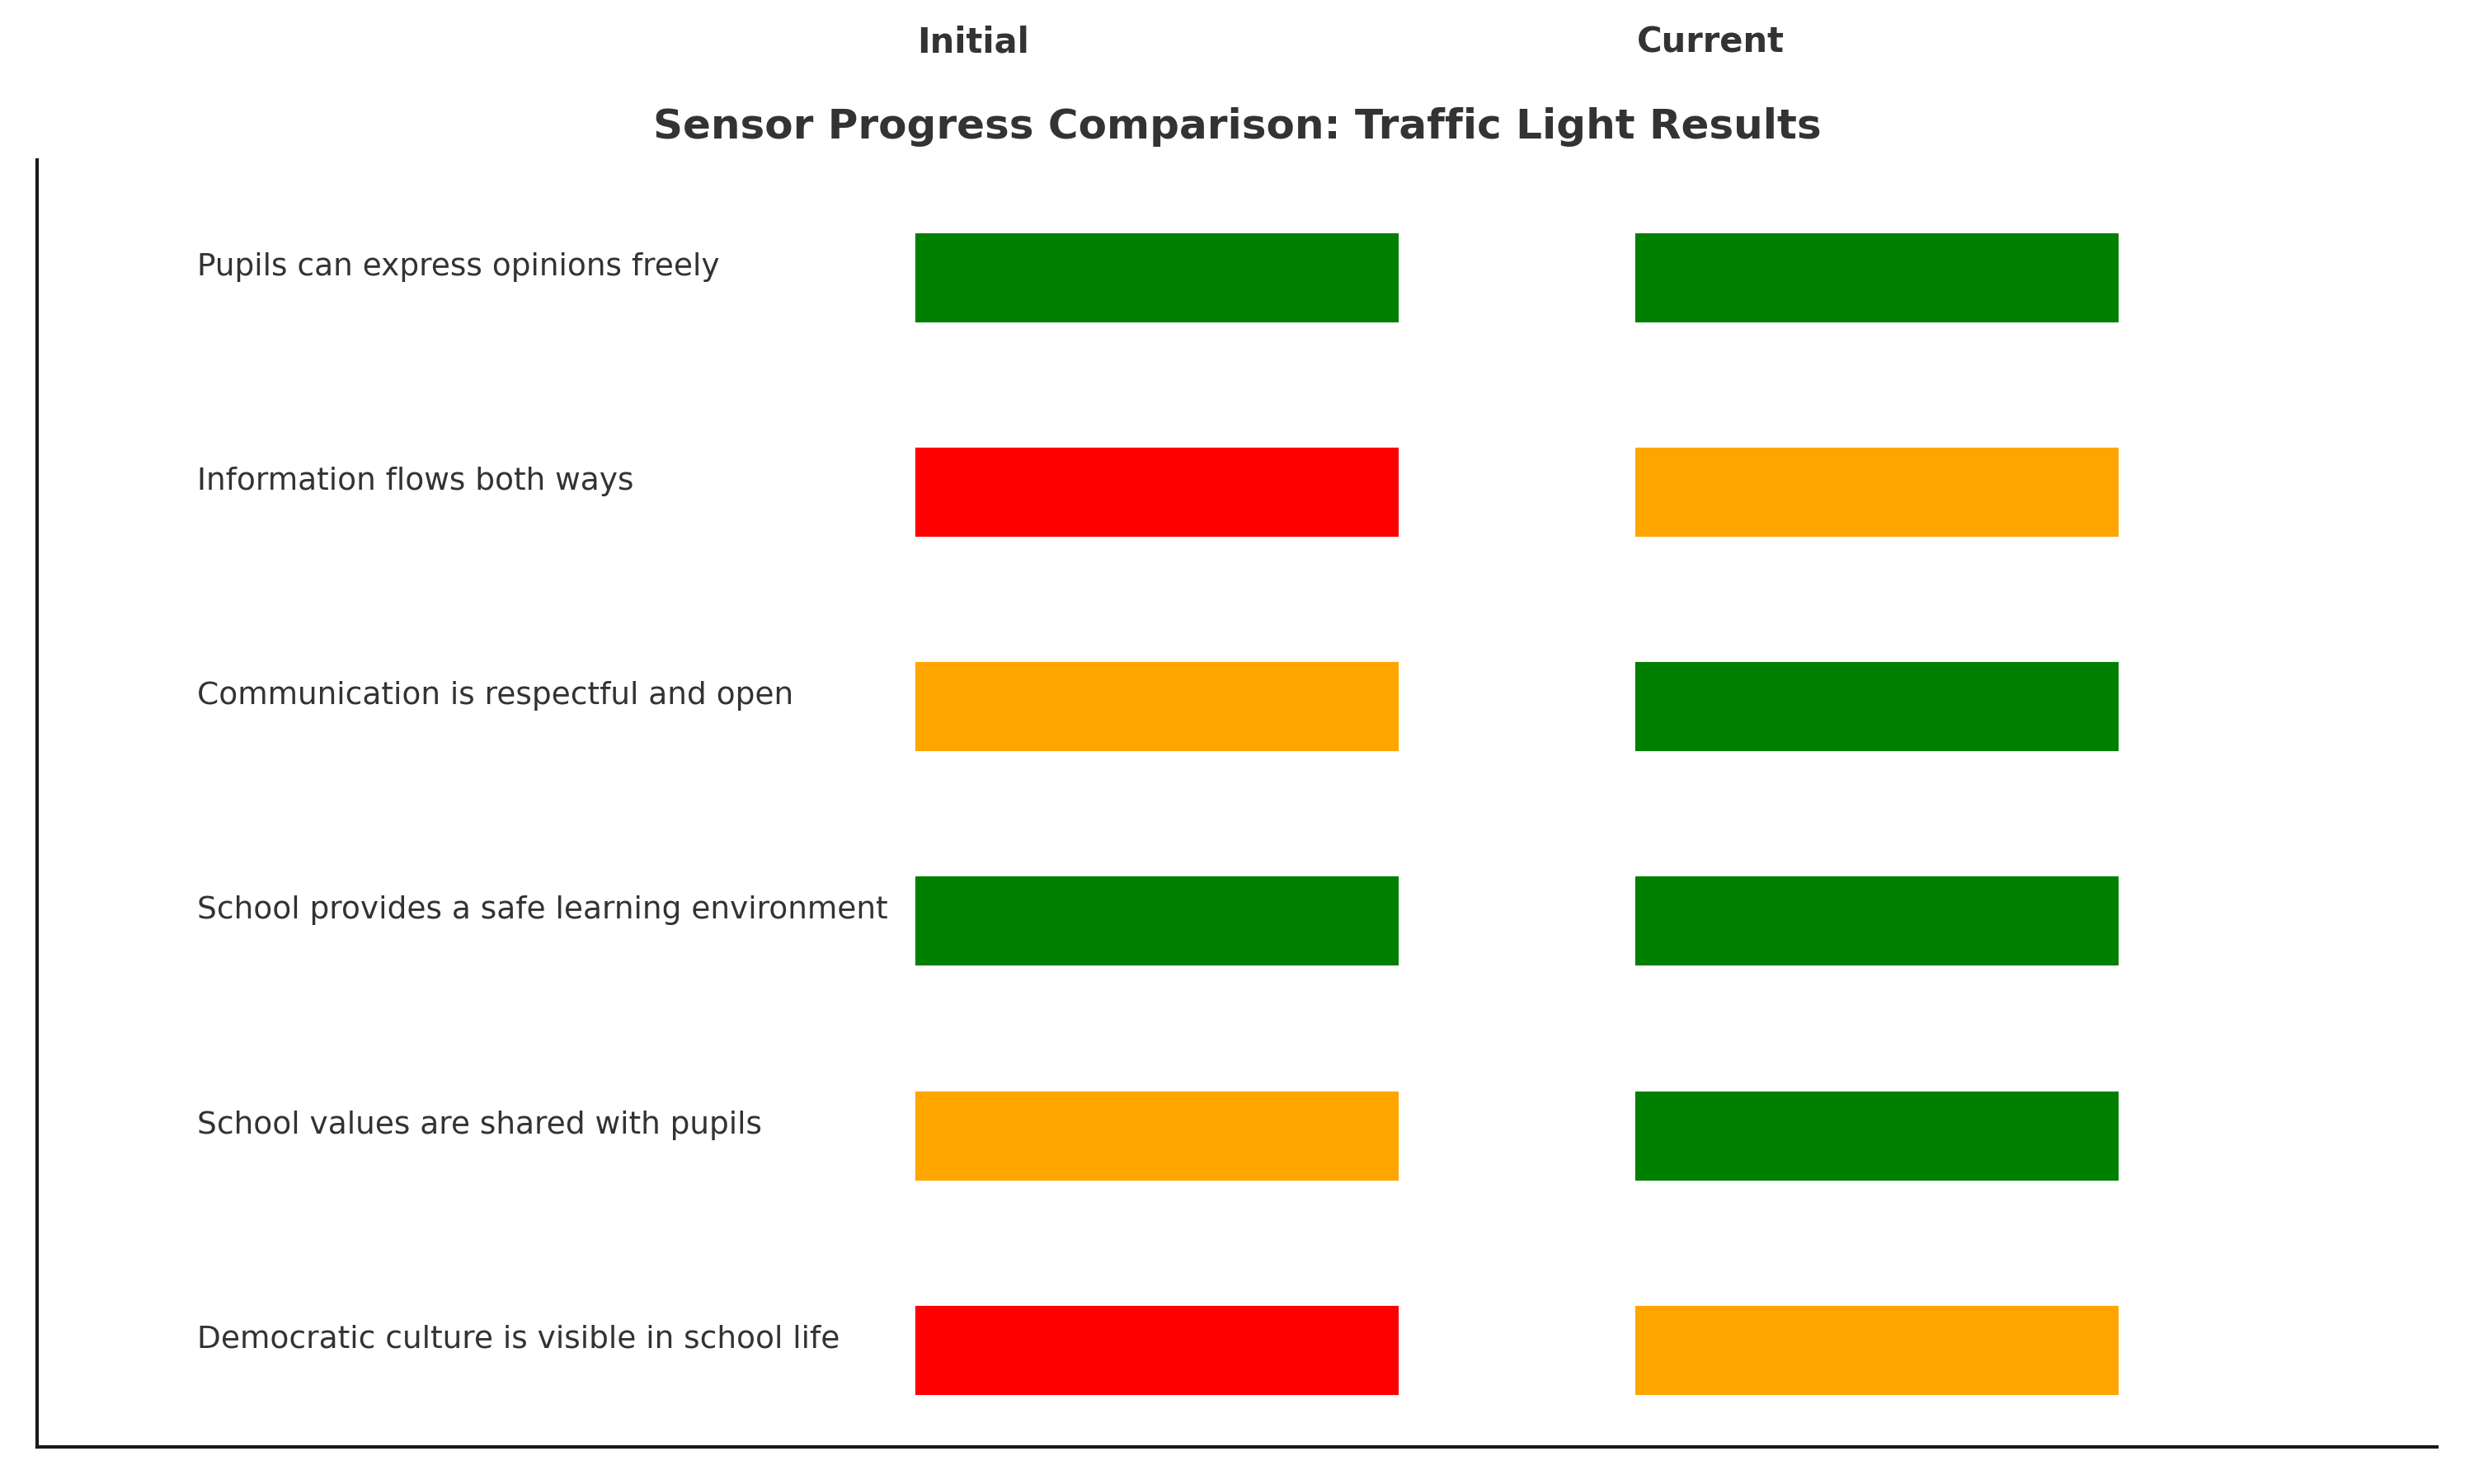
The coACTION Sensor evaluates school practices using a traffic light system:
-
🟥 Red – Starting level / Low presence of democratic practice
-
🟧 Orange – Developing level / Some elements present
-
🟩 Green – Established level / Strong and consistent practice
When you reapply the Sensor, you’ll receive updated colours for each subarea and quality area. The key to progress is to compare these colours with those from the first application.
How to Compare Your Results
-
Use the same categories and structure (e.g., Area 1.2 – School values are shared with pupils).
-
Place the old and new results side by side.
-
Track changes:
-
Red → Orange = progress
-
Orange → Green = strong development
-
No change = stability
-
Green → Orange or Red = potential regression or new challenges
-
Ways to Visualise the Comparison
-
Use a table or matrix to map old and new results per subarea
-
Create colour-coded bar charts or progress arrows
-
Mark subareas with positive change using ✅ or ⭐ to celebrate growth
-
Highlight unchanged or regressing areas for focused reflection
Tools You Can Use
-
Your Sensor platform may offer a built-in deviation analysis view
-
If not, use:
-
Spreadsheets (Excel or Google Sheets) to map colours
-
Manual progress tables (a template will be provided in Session 3)
-
Visual aids like posters or slides for internal discussions
-
Download Your Editable Comparison Table (PDF)
To help your school track changes in Sensor results, you can download and fill in an editable PDF version of the Sensor Progress Comparison Table.
Click here to download the editable PDF version
Need Help?
If you need support:
-
Contact your regional coACTION coach
-
Use the help guide from Module 2
-
Post a question in the "Notifications" forum
Tip for Project Groups
Before you proceed to evaluation:
-
Make sure everyone in your project group has access to both sets of results.
-
Print out key pages, if needed, for easier group discussion.
Zuletzt geändert: Montag, 4. Mai 2026, 16:38